Tax Explorer
 September 2025
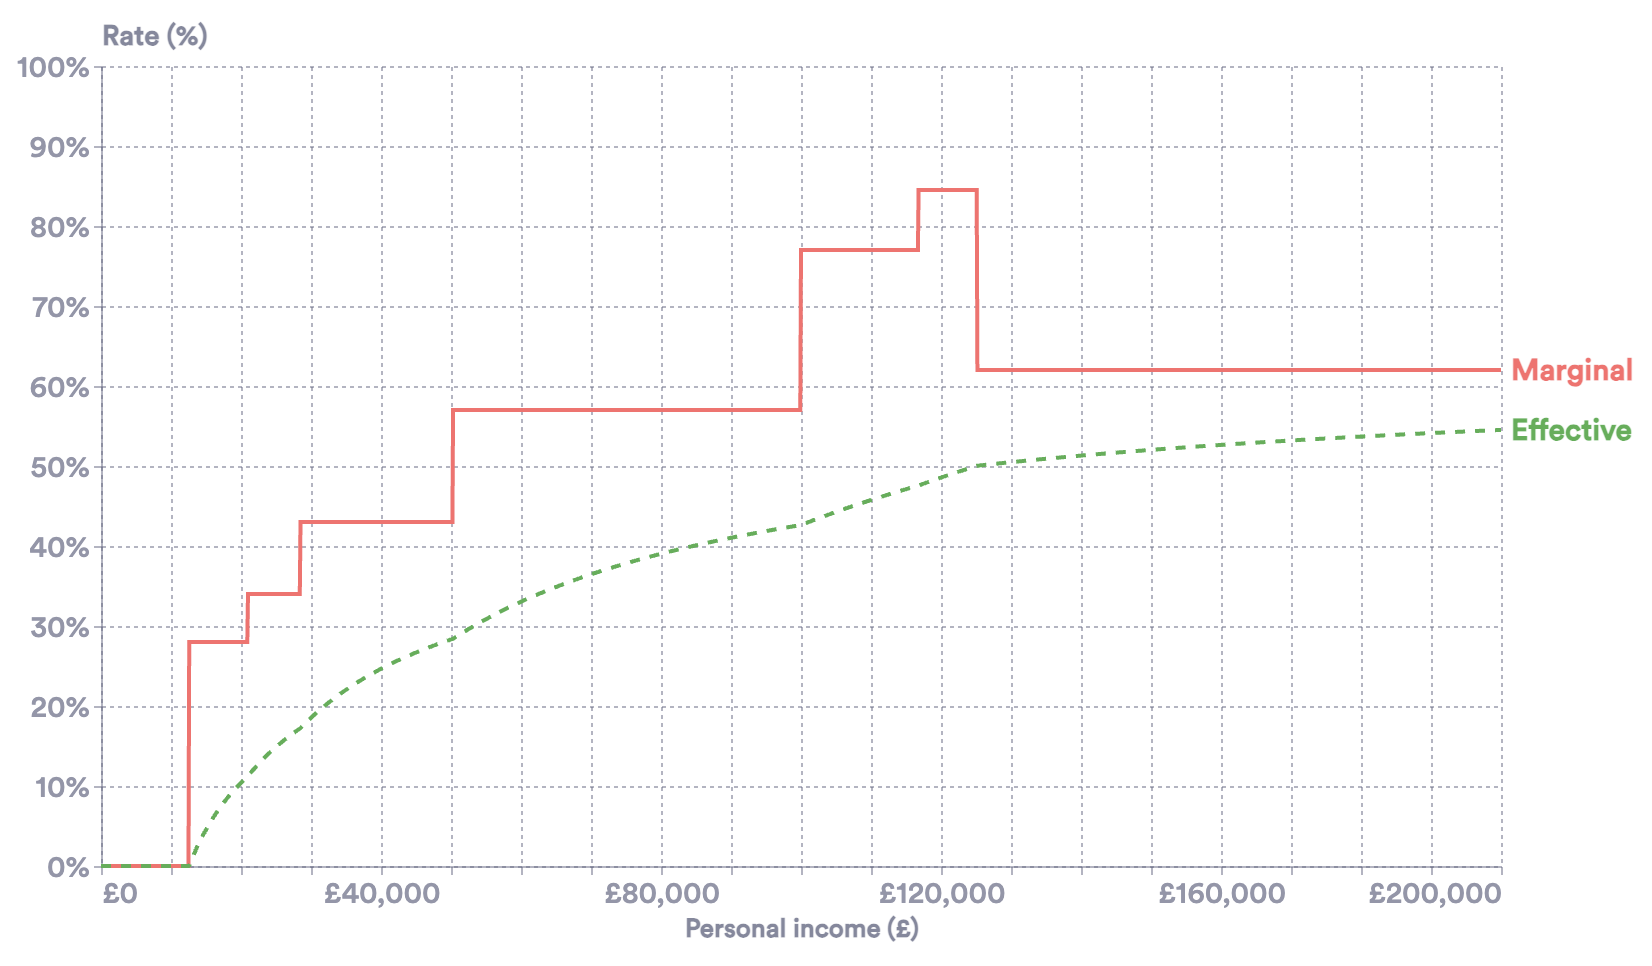
Visualise your marginal tax rates. Under development
UK Dashboard
November 2024Live dashboard of UK economic indicators. Under development
Chart Tutorials: Vega-Lite
October 2024Growing collection of tutorials related to chart building using Vega-Lite. Under development
21 charts for 21 countries
 May 2024
World's 21 most populous countries, compared through a series a charts on five economic topics. These charts were produced for LSE's Growth Day 2024.
Local Authority Debt
May 2024Visualising the debt crisis across UK Local Authorities.
Economics for Everyone
March 2023Selection of charts produced for a new macroeconomics course at the University of Chicago.
London crime during the pandemic
 January 2023
Data analysis assignment for UoB software & programming module.
Housing
April 2022Selection of charts on house building in the UK. Produced for the Economics Observatory.
Monetary Policy
April 2022Selection of charts focusing on key economic indicators related to Unit 10 of the Core Econ textbook: Banks, Money and the Credit Market. Produced for the Economics Observatory.
Data Science: Project
 January 2022
Renewables and the potential for solar. The page holds a collection of charts produced for the Data Science course final project.
Data Science: Portfolio
December 2021A collection of charts produced throughout the Data Science unit, part of the University of Bristol Economics course. Each chart demonstrates different data science and visualisation techniques.